This appendix provides the technical information used to support the development and application of vertical screening distances for PVI. The information is provided through a Frequently Asked Questions (FAQ) format.
New data has prompted the development of a new screening approach for PVI. Numerous site investigations have been undertaken to assess the potential for PVI, yet actual confirmed occurrences are rare (Fitzpatrick and Fitzgerald 2002; Hers et al. 2003; Tillman and Weaver 2005; McHugh et al. 2010). The issue can largely be attributed to conservative screening levels derived using the J&E model (1991) or empirical attenuation factors (AFs) derived primarily from chlorinated hydrocarbon data (USEPA 2012j), neither of which take into account biodegradation in the vadose zone (Tillman and Weaver 2005). The effect of biodegradation in the vadose zone on PVI had not been previously quantified sufficiently to meaningfully incorporate into a regulatory framework to improve site screening.
The use of AFs for PVI screening has recently been brought into question through a number of key modeling studies (Abreu, Ettinger, and McAlary 2009b; API 2009) and empirical studies (Hers et al. 2000c; Davis 2009, 2010; Peargin and Kolhatkar 2011; Wright 2011; USEPA 2013a; and Lahvis et al. 2013a). The studies have shown that:
The noted variability and sharp decrease in AFs at some critical distance above the PHC vapor source limits applicability of AFs for PVI. The behavior of PHC COCs in the vadose zone is more amenable to a PVI screening method based on vertical separation distance or vertical screening distance.
Vertical screening distances for dissolved-phase and LNAPL sources were derived based on collective findings from laboratory, modeling, and most importantly, recent field (empirical) studies conducted by Davis (2009, 2010); Peargin and Kolhatkar (2011); Wright (2011); USEPA (2013a); and Lahvis et al. (2013a). The empirical studies were critical in:
The empirical studies include data for groundwater, soil, and soil gas from hundreds of PHC release sites spanning a range of environmental and site conditions, geographical regions, and a 16-year time period (1995–2011) of data collection. Fuel types included gasoline containing as much as 10% vol/vol ethanol or 15% vol/vol methyl tert-butyl ether (MTBE).
Several empirical studies were undertaken to derive risk-based vertical screening distances for PVI applications from soil gas concentration data. Vertical screening distances were derived specifically for dissolved-phase and LNAPL sources. The empirical studies are described below and summarized in Table F-1:
USEPA (2013)
The USEPA (2013a) study involved a detailed assessment of hundreds of (primarily) UST and non-UST (terminal and refinery and one petrochemical) sites located mainly in North America. The database was originally compiled by Davis (2009) and included a large data set from Maine that was later added by USEPA (2013a). The database spanned a range of environmental site conditions, lithologies, surface covers (e.g., building foundation pavement, open ground) and PHC sources (such as gasoline, diesel, kerosene, and jet fuel) and a broad period of data collection (1995–2011). The composition of the PHC source at sites was largely unknown. Gasoline sources may have contained up to 10% by volume ethanol and up to 15% by volume MTBE. Sites with sources containing greater than 10% vol/vol ethanol were not included in the database analysis. The databases contain general information on concentrations of hydrocarbons (such as benzene, TPH, naphthalene) and fixed gases (such as O2, CO2, and CH4) in soil gas, hydrocarbon concentrations in groundwater and soil, source depth, and surface cover. Virtually all of the soil gas data reported in the database were collected from permanent vapor probes and analyzed using commonly accepted methods (for example, EPA Method TO-15, EPA Method TO-3, Modified EPA 8260, and Massachusetts Air Phase Hydrocarbons for hydrocarbons; ASTM D1946 and EPA Method 3C for fixed gases). The database included 38 sites with subslab vapor samples.
The derivation of screening distances required the differentiation of PHC vapor sources (LNAPL and dissolved-phase) and identification of LNAPL sources in the vadose zone. The effort also included a review of groundwater monitoring data, borehole logs, and field notes. LNAPL was assumed to be present at locations where benzene and TPH (gasoline) concentration in groundwater exceeded 5 mg/L or 30 mg/L, respectively, and where benzene and TPH (gasoline) concentrations in soil exceeded 10 mg/kg or 250 mg/kg, respectively. The latter criterion is not expected to be significant given that it was used to solely identify residual-phase LNAPL in less than 2% cases.
The database was extensively reviewed to ensure that it met strict data QA/QC standards for interpretation and analysis. QA/QC of the data included review of:
Site data were also scored based on overall data quality and confidence in the hydrocarbon CSM. Suspect data associated with unacceptable QA/QC tests (for example, tracer tests), sample methods and analyses, or likely presence of LNAPL sources in the vadose zone were flagged and eliminated from further consideration. The USEPA (USEPA 2013a) database is publicly available at: http://www2.epa.gov/sites/production/files/2014-09/documents/pvi_database_report.pdf.
Vertical screening distances were determined as a function of source type (dissolved phase, LNAPL), COC type (benzene, xylenes, hexane, C5–C8 aliphatics, C9–C12 aliphatics, C9–C18 aromatics), site type (UST, non-UST), soil type (fine and coarse-grained), and surface cover (pavement, building foundation, and open ground). The vertical screening distances were determined using two different methods: the clean soil method described by Davis (2010) and a vertical distance method. The clean soil method is based on estimating (interpolating between vapor probes) a thickness of relatively clean biologically active soil (containing O2) required to biodegrade hydrocarbon vapors to below a specified risk-based COC concentration in soil gas. The vertical distance method is based on estimating the distance of a soil probe above the source where the soil gas concentration is below a specified risk-based concentration. The two methods generally resulted in similar screening distance estimates even though the vertical distance method generally involved less uncertainty. Key findings from USEPA (2013a) are reported in Table F-1.
Lahvis et al. (2013)
Lahvis et al. (2013a) evaluated soil gas data collected only from UST sites. These data were obtained from studies by Wright (2011) and USEPA (2013a). The combined database comprised 728 soil gas (hydrocarbon and fixed gas – O2, CO2, and CH4) samples from 120 UST sites and 332 sampling locations. Screening distances were only derived for benzene.
Lahvis et al. (2013a) used an approach similar to the one used by USEPA (2013a) to discriminate between dissolved-phase and LNAPL sources, identify hydrocarbon sources in the vadose zone, and eliminate poor-quality or suspect data. Approximately one-third of the soil gas samples in the database were collected in relatively high permeability sand, gravel, and fill material; the remaining two-thirds were collected in relatively low permeability silts, silty clay, and clay. Of the soil gas samples, 11% were from subslab locations, and the remaining samples were assumed to be evenly distributed between those located beneath pavement and those located beneath open ground. The dissolved-phase data set consisted of 261 soil gas measurements from 47 sites and 128 sample locations; the LNAPL data set consisted of 467 soil gas measurements from 73 sites and 204 sample locations. Source-receptor separation distances were calculated using the “vertical distance” method described by USEPA (2013a). Key findings from Lahvis et al. (2013a) are also reported in Table F-2.
Davis (2009, 2010)
Davis (2009) analyzed 259 benzene and 210 TPH vapor samples from 53 geographical locations in the U.S. and Canada. The database contained soil gas and co-located, concurrent groundwater data collected at UST and non-UST sites over a 16-year period (from 1995 to 2011) as well as site-specific information on soil type, depth to groundwater, presence of free product, and concentrations of benzene and TPH in both the dissolved phase and the soil vapor phase. Davis (2009) estimated that 5 feet (1.5 m) and up to 30 feet (about 10 m) thicknesses of clean soil (vertical separation distance) were required to biodegrade PHC vapors emanating from dissolved-phase and LNAPL sources, respectively, to below specified soil gas concentrations of concern for vapor intrusion. The screening distances for LNAPL sources were later revised to 8 feet after accounting for residual-phase LNAPL sources above the water table (Davis 2010). A significant portion of data was from published field studies.
Peargin and Kolhatkar (2011)
Peargin and Kolhatkar (2011) found that target 10-5 risk-based concentrations of benzene in near-slab soil gas samples (300 mg/m3) were only exceeded at distances of over 15 feet from relatively high concentration sources (defined by dissolved-phase benzene concentrations, greater than 1,000 µg/L). In addition, benzene concentrations in soil gas were generally over 30 mg/m3 above inferred dissolved-phase sources. Soil gas data collected from the following locations were excluded from the analysis:
The analysis included an evaluation of 218 pairs of benzene soil vapor and groundwater concentration data from 25 sites (20 in California). The 1000 µg/L benzene concentration used to distinguish dissolved phase source versus. LNAPL source was empirically derived as the most conservative average benzene concentration (about 5th percentile concentration) observed in time series data from 269 wells (83 sites) that at one point in time showed measurable LNAPL thickness in the well.
Wright (2011, 2012)
Wright (2011) included data from 1083 pairs of benzene soil vapor and groundwater concentration data collected from 124 sites in Australia, from both UST and a few non-UST sites (including refineries and terminals). Benzene concentrations biodegraded below a risk-based screening level of 50 mg/m3 at distances ranging from 5 to 10 feet (1.5 to 3 m) for dissolved-phase hydrocarbon sources (defined by dissolved-phase benzene concentrations greater than 1 mg/L and TPH concentrations greater than 10 mg/L) to around 30 feet (10 m) for some LNAPL and poorly characterized dissolved-phase sources. Subsequent analysis (Wright 2012) found that soil gas screening level concentrations were only exceeded at distances 12 feet (about 4 m) above LNAPL sources. The analysis did not consider subslab soil gas samples.
The calculated screening distances were deemed relevant to all soil types, including fractured rock systems, given that 41% of the soil gas data were collected in such hydrogeologic systems. Among the soil gas samples, 28% were associated with dissolved-phase sources, and the remaining 72% were associated with LNAPL sources. The database underwent extensive QA/QC similar to that in the USEPA study (2013a), including the scoring of site data. The empirical data from this study are used to support regulatory guidance development for Australia CRC for Contamination Assessment and Remediation of the Environment (CRC CARE 2013).
Key findings of the empirical studies are summarized below. In general, the vertical screening distances and findings reported in the various independent empirical studies involving differing methods and screening levels are all similar (see Table F-1). Findings from two of the more detailed empirical studies (Lahvis et al. 2013a; USEPA 2013a) are summarized in Table F-2. In general, vertical screening distances for dissolved-phase sources range between 0 and 5 feet. Vertical screening distances for LNAPL sources vary slightly depending on site type, ranging from 13 to 15 feet at petroleum UST sites to 18 feet at terminal, refinery, or petrochemical sites. Studies of the empirical data show a 93% confidence in the vertical screening distances for petroleum UST/AST sites and 90% confidence for petroleum industrial sites. There is also more uncertainty with the industrial sites as a result of a relatively small data set of industrial sites (USEPA 2013a). Differences in the vertical screening distances according to site type may relate to the volume of the LNAPL release or extent of the LNAPL plume. Large releases of PHC can result in a large oxygen demand, which reduces biodegradation of the PHC. Petroleum industrial sites, such as terminals, refineries, and petrochemical sites tend to have large infrastructure and may have multiple releases from different locations, which can also exert a high oxygen demand. Given that LNAPL release volumes and plume extents may not always correlate with the site type, a good CSM and professional judgment are needed to select the most appropriate LNAPL vertical screening distance.
Hydrocarbons were also predicted to biodegrade by several orders of magnitude across a relatively narrow (less than 3 feet) region above the PHC vapor source where conditions in the vadose zone transition from anaerobic to aerobic (Abreu, Ettinger, and McAlary 2009b; API 2009); see Figure 3-1. The transition between anaerobic and aerobic biodegradation occurs at O2 soil gas concentrations in the range of 1% to 4% v/v (DeVaull 2007). The rapid hydrocarbon attenuation is attributed to rates of aerobic PHC biodegradation occurring much faster than rates of physical hydrocarbon transport through the vadose zone by molecular diffusion (Davis, Patterson, and Trefry 2009). Just above the aerobic biodegradation zone, soil gas concentrations of key COCs for PVI (e.g., BTEX, TPH fractions) were found to biodegrade below levels of concern for PVI (Davis 2009, 2010; Davis, Patterson, and Trefry 2009; Peargin and Kolhatkar 2011; Wright 2011; Lahvis et al. 2013a; and USEPA 2013a).
The findings of the studies show that the vertical distance required to biodegrade PHC COCs below levels of concern varies depending on whether the source is LNAPL or a dissolved-phase plume in groundwater. In general, the aerobic biodegradation zone will develop at a higher elevation (or shallower depth) above LNAPL sources because (a) PHC COC concentrations are greater for LNAPL sources than dissolved-phase sources; and (b) LNAPL sources are invariably distributed (by water-table fluctuation induced smearing) above the capillary zone where the vadose zone soils are more conducive to vapor migration (less water saturated); see Figure 3-1. The aerobic biodegradation zone will develop at various distances above LNAPL sources depending on fuel type, composition, and degree of weathering. In general, the aerobic biodegradation zone will develop farthest above LNAPL sources containing large fractions of volatile, aerobically biodegradable hydrocarbons (meaning fresh gasoline rather than diesel or weathered gasoline) and gasoline containing over 10% vol/vol ethanol. High ethanol content fuels have the potential to generate significant concentrations of methane in soil gas (1% to 20%) upon biodegradation in groundwater (Ma et al. 2012). Subsequent oxidation of methane in the vadose zone can reduce the amount of O2 available for PHC biodegradation and potentially increase the vertical separation distance necessary to biodegrade hydrocarbon COC concentrations in soil gas below levels of concern for PVI. In contrast, the aerobic biodegradation zone tends to develop near dissolved-phase hydrocarbon sources (for example, near the capillary zone) because the hydrocarbon mass flux is more limited than for LNAPL sources. The hydrocarbon mass flux is limited by relatively low source concentrations (compared to LNAPL), relatively slow rates of vapor migration (through the capillary zone), and significant biodegradation in the capillary zone. The relative low hydrocarbon mass flux to the vadose zone (and demand for O2) is insufficient to drive conditions in the vadose zone extensively anaerobic, even below building foundations and relatively impermeable surface covers (Abreu, Ettinger, and McAlary 2009b; McHugh et al. 2010; Lahvis et al. 2013a; USEPA 2013). PVI cases involving dissolved-phase PHC sources separated vertically from building foundations are also not found reported in the literature (McHugh et al., 2010).
The vertical screening distances are also expected to apply laterally in the absence of hydrogeologic barriers (such as perched water tables or low-permeability soil lenses) or preferential pathways (sewer corridors or fractured rock) that could potentially enhance lateral hydrocarbon vapor migration. It may be challenging or infeasible, however, to accurately delineate the edge of a contaminant plume within the relatively short vertical screening distances (0 to 5 feet) defined in the empirical studies (see Table F-1). Furthermore, the distance between a dissolved-phase plume and building foundation can vary over time with mobile or expanding plumes or changes in groundwater flow direction. Lahvis et al. (2013a) recommend the use of lateral offset (or buffer) distances (for example, 20 feet) to account for uncertainties in dissolved-phase plume delineation and changes in groundwater flow direction. Larger buffer zones may be appropriate in cases where there is more than 20 feet uncertainty in defining the edge of the dissolved-phase plume. In general, lateral offset buffer distance should not be applied at the leading edge of a mobile or expanding dissolved-phase plume where the distance between the plume and building may reduce over time (unless the depth to groundwater exceeds the vertical screening distances for all buildings located within the potential path of the plume.)
|
Reference |
Screening distance |
||
|---|---|---|---|
|
Dissolved-phase |
LNAPL (UST/AST sites) |
LNAPL (industrial sites) |
|
|
Lahvis et al. (2013a) |
5 feet (1.5 m) Notes:
|
13 feet (4 m) |
Not assessed |
|
USEPA (2013a) |
0 – 5.4 feet (0–2 m) Note:
|
13.5 – 15 feet (4–5 m) |
18 feet (6 m) Note:
|
|
Davis (2009) |
5 feet (1.5 m) Note: Screening distance based on:
|
8 feet (3 m) |
30 feet (10 m) |
|
Peargin and Kolhatkar (2011) |
5 feet (1.5 m) Note:
|
15 feet (5 m) Note:
|
Not assessed |
|
Wright (2011) |
5–6 feet (1.5–2 m) Note:
|
13 feet (4 m) Note:
|
Not assessed |
|
GENERAL |
|
|
DISSOLVED-PHASE SOURCES |
|
|
LNAPL SOURCES |
|
|
ADDITIONAL FINDINGS |
|
Note that insufficient data were available to assess screening distances for sites with preferential pathways (such as underground sewers, fractured rock), high organic-rich (for example, peat) soils or excessively dry soils in arid environments, large building foundations (such as those associated with industrial/commercial sites or apartment complexes), high-ethanol content fuel (for example, E85) releases, historical gasoline releases containing lead scavengers (1,2 DCA, EDB, or both). The screening distance method is thus not recommended for application if such environmental or site conditions are encountered. In addition, the screening distance method is generally not recommended at sites with mobile or expanding plumes that are expanding in the direction of current or future buildings. These sites may require additional characterization. It may, however, be possible to ignore this precluding factor if sufficient vertical separation exists between the source and building foundation (that is, the vertical separation distance exceeds the relevant screening distance). For example, further PVI assessment would not be necessary at a UST/AST site with an expanding LNAPL plume provided the vertical separation distance exceeds 15 feet.
The model studies of Abreu and Johnson (2005, 2006), DeVaull (2007), Abreu, Ettinger, and McAlary (2009b), API (2009), and Davis, Patterson, and Trefry (2009) generally support the findings from the empirical studies, even though the modeled vapor biodegradation is usually less than the observed. This difference indicates that the models are conservative with respect to the assumptions on hydrocarbon biodegradation and transport. In general, biodegradation in the vadose zone is shown to be relatively rapid at some distance above the hydrocarbon source where conditions in the vadose zone become aerobic. Aerobic biodegradation is predicted to significantly limit hydrocarbon vapor migration above dissolved-phase sources. The presence of building foundations overlying dissolved-phase sources also has little effect on the PHC biodegradation because the mass flux of hydrocarbons is limited by relatively low source concentrations and relatively slow transport through the capillary zone. PHC vapor biodegradation above LNAPL sources is predicted to be more variable and potentially sensitive to limitations on O2 transport caused by building foundations or other surface features (such as pavement). The effect from building foundation and pavement will vary depending on the hydrocarbon vapor source concentration (related to source type and weathering), source depth (for example, separation distance between the source and building foundation), and biodegradation rate.
The model studies are summarized in more detail as follows:
Abreu and Johnson (2005)
Abreu and Johnson (2005) examined the effects of lateral source separation on the vapor attenuation of nondegrading COCs. For shallow sources of potential concern (for example, vertical separation distances of about 10 feet), the predicted vapor concentration decreased by approximately two orders of magnitude for every 45 feet of lateral offset for a slab-on-grade foundation in sandy soil. The sensitivity of vapor attenuation to lateral offset is expected to increase for degrading compounds (for example,. PHC COCs).
Abreu and Johnson (2006); Abreu, Ettinger, and McAlary (2009); American Petroleum Institute (2009)
Abreu and Johnson (2006) and Abreu, Ettinger, and McAlary (2009b; described in greater detail in API 2009) simulated the behavior of reactive hydrocarbon COCs and, in particular, the effect of aerobic biodegradation rate, source concentration, and source depth, on PHC vapor biodegradation. PHC biodegradation was predicted to increase with decreasing vapor source concentration and increasing vertical separation distance and biodegradation rate. PHC vapors were predicted to biodegrade by over seven orders of magnitude over relatively short vertical distances (for example, 6 feet or 2 m) above low concentration PHC vapor sources, i.e., representative of dissolved-phase sources. For the low concentration vapor sources, residential-sized building foundations had little effect on O2 availability and PHC biodegradation. The PHC biodegradation predicted above LNAPL sources was more variable. The model predicted that approximately 23 feet was required to fully biodegrade benzene vapors emanating from unweathered, high concentration (200 mg/L) vapor sources assumed representative of fresh gasoline. Building foundations had little effect on hydrocarbon biodegradation for these scenarios.
In these studies, hydrocarbon (benzene) was assumed to aerobically biodegrade at rates (l = 0.18 to 0.79 hr-1) which is consistent with mean values published from literature studies (DeVaull, 2007). At these rates, PHC vapors were predicted to biodegrade by roughly two orders of magnitude for each additional meter increase in the vertical separation distance provided conditions in the vadose zone were aerobic. Note that while the aerobic biodegradation rates may seem high, the models assume that biodegradation can occur when the chemical is in the dissolved phase (in soil pore water) and when O2 concentrations in soil gas exceed 1% vol/vol (i.e., in the aerobic portion of the vadose zone). In addition, the models do not account for limitations on vapor diffusion associated with transport through the capillary zone which can be significant (McCarthy and Johnson1993); see Chapter 1. In lower permeability soils, such as silty clay (API 2009), PHC biodegradation was greater using a similar range of source concentrations and degradation rates and for sources displaced laterally from building foundations (as previously noted in Abreu and Johnson 2005). The models indicate that dissolved-phase PHC sources displaced laterally from the edge of a building foundation by more than a few meters are expected to pose little risk for PVI.
DeVaull (2007)
The work of DeVaull (2007) further supports the findings of Abreu and Johnson (2006). Again, the attenuation factor is shown to be highly sensitive to the vertical separation distance between the source and building foundation. For example, the vapor attenuation factor was shown to decrease by more than nine orders of magnitude when the vertical separation distance was increased approximately three-fold.
Davis, Patterson, and Trefry (2009)
Davis, Patterson, and Trefry (2009) developed a simple biodegradation model that couples hydrocarbon transport and O2 availability in the vadose zone. The model was used to explain observed behavior of hydrocarbon and O2 in the vadose zone at seven field sites in Australia with varying surface cover (such as open ground or under a building). Hydrocarbon biodegradation rates were shown to be essentially instantaneous compared to rates of physical transport associated with gas-phase diffusion and advection. Total hydrocarbon vapor concentrations were not observed above detection limits (200 mg/L or 200,000 mg/m3) unless O2 concentrations in soil gas were less than 5% v/v. Biodegradation rates determined by model calibration were generally an order of magnitude higher for aliphatic hydrocarbons than for BTEX. This finding is consistent with the mean biodegradation rates for hydrocarbons published in DeVaull (2007).
Some regulatory agencies may apply soil gas screening levels less than those in the empirical studies to derive the vertical screening distances. For example, the soil gas screening levels for benzene found in some regulatory guidance (see Eklund et al. 2012) may be an order of magnitude less (3.1 mg/m3) than the value (30 mg/m3) used by Lahvis et al. (2013a) in the derivation of vertical screening distances. A lower screening level will result in a longer vertical screening distance because more vertical source separation is necessary to biodegrade PHC COCs below a lower soil gas screening level.
As shown in Table F-3, lower soil gas screening levels are not likely to significantly increase the vertical screening distance. This result is consistent with the findings of DeVaull (2007) and Abreu, Ettinger, and McAlary (2009b). Vertical screening distances for dissolved-phase sources increase from approximately 0 to 7 feet for benzene soil gas screening levels decreasing from 100 to 1 mg/m3, respectively (see Table F-3). This variability is consistent with the range of vertical screening distances (0–5.4 feet) derived for dissolved-phase sources using independent methods (USEPA, 2013a). Vertical screening distances for LNAPL sources increase from approximately 13.2 to 16.6 feet for benzene soil gas screening levels decreasing from 100 to 1 mg/m3, respectively. Again, this variability is consistent with the range of vertical screening distances (13–15 feet) derived for LNAPL sources using independent methods (Lahvis et al. 2013a; USEPA 2013a). Vertical screening distances for COCs other than benzene would be expected to increase similarly for equivalent differences in soil gas screening levels.
|
Benzene soil gas screening level (mg/m3) |
LNAPL screening distance (feet) |
Dissolved-phase screening distance (feet) |
|---|---|---|
|
100 < |
13.2 |
0.3 |
|
50 < |
13.6 |
0.91 |
|
30 < |
14.0 |
1.5 |
|
20 < |
14.3 |
2.0 |
|
10 < |
14.8 |
3.0 |
|
5 < |
15.4 |
4.1 |
|
1 < |
16.6 |
6.7 |
The following discussion explains the technical justification for the values in Table F-3. Direct application of the methods used by Lahvis et al. (2013a) and USEPA (2013a) to calculate soil gas screening distances for benzene soil gas screening levels < 30 μg/m3 is problematic because of the influence of background sources and because of a significant fraction of nondetect soil gas concentration data at these low concentration levels. Hydrocarbon biodegradation can, however, be assumed to be aerobic at these hydrocarbon concentrations and be approximated with distance using the following exponential decay expression (DeVaull 2007):
where (c1, c2) are soil gas concentrations at distances (x1, x2), and LR is a diffusive reaction length.
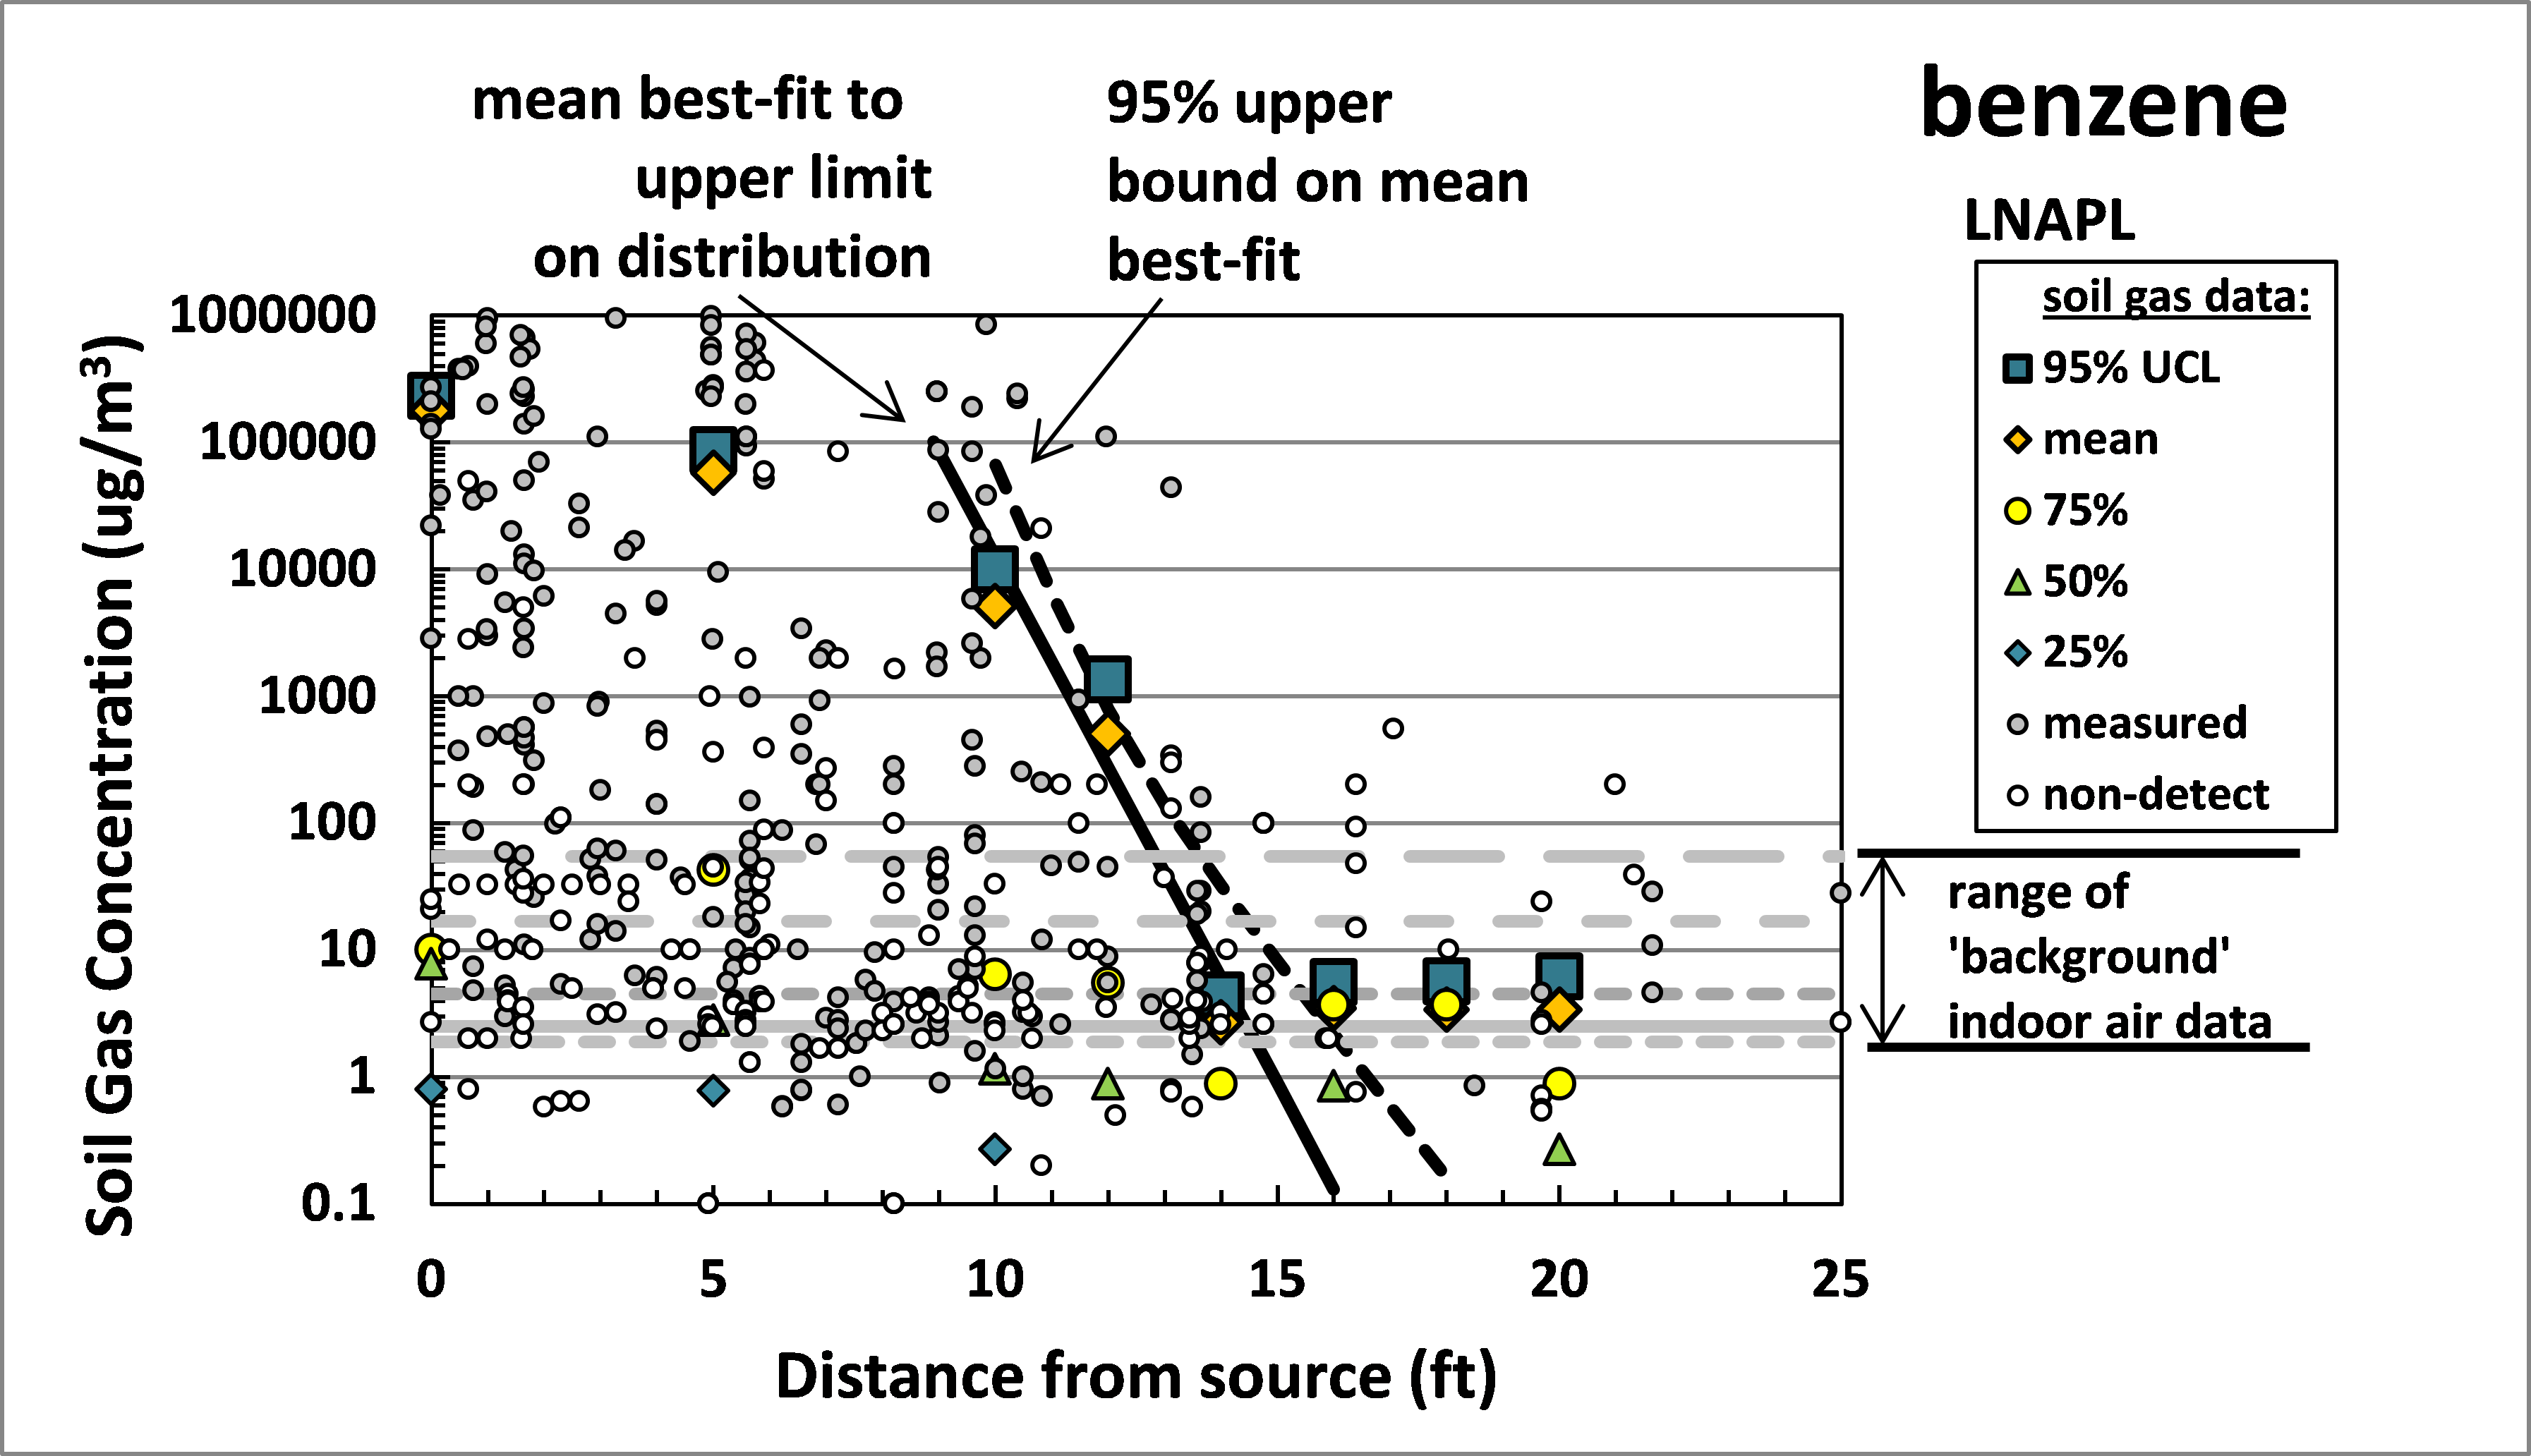
For LNAPL sources this relation is applied to the 95% upper bound level of the benzene soil gas concentration versus distance values for data reported in Table 1. Benzene soil gas concentration values greater than 10,000 mg/m3 are excluded from the analysis as they are very likely to be in an anaerobic soil zone. The resulting best-fit linear regression is shown in Figure F-1, along with the 95% upper bound on the best-fit regression estimate, following the methods presented in Bendat and Piersol (2010). The statistics of the data fit are included in Table F-2. The mean best-fit estimate can be defined as:
The 95% upper bound on the mean best-fit regression estimate, for which parameters are defined in Table F-2, is given by
The 95% upper bound (a = 0.05) on the best fit regression depends on the number of data points, N, included in the regression. As a conservative minimum, the value N = 6 is applied. For higher values of N, the 95% upper bound will be closer to the mean best-fit estimate.
The empirical LR parameter found in this evaluation is 0.52 feet, which is consistent with the values and ranges presented in extensive evaluation of aerobic benzene biodegradation in soils (DeVaull 2011). Note that the lower level soil gas concentrations, including all values below the 75% level on the distribution, are within the range of background indoor air.
For a dissolved-phase benzene source in groundwater, the trend in the 95% upper bound distance values in Table 1 of Lahvis et al. (2013a) are similarly evaluated to define a mean best-fit trend and a 95% upper bound on the mean best-fit trend. The result is shown in Figure F-2. The value of LR found for this data set is 1.0 feet, which is greater than for the LR value defined from LNAPL data, but within the expected range.
Figure F-1. Vertical screening distance values for an LNAPL source estimates based on soil gas data analysis from Lahvis et al. (2013a). A mean best-fit to the distribution and an upper bound on the mean best-fit are shown. The overlap of lower-level soil gas data with background concentrations (Dawson and McAlary 2009) is also shown.
Note that the soil gas concentrations are significantly lower than for the LNAPL source data, and that a larger proportion of the data falls within the range of background indoor air. Additional statistics of the data fit are included in Table F-4.
Note that, in Figure F-2, a significant fraction of benzene soil gas concentrations collected at sites affected by high levels of subsurface PHC are at and below the range of expected background air concentrations. Soil gas concentrations lower than ambient background are an indication of benzene biodegradation losses from both benzene vapors originating from subsurface sources and from background air concentrations at the surface.
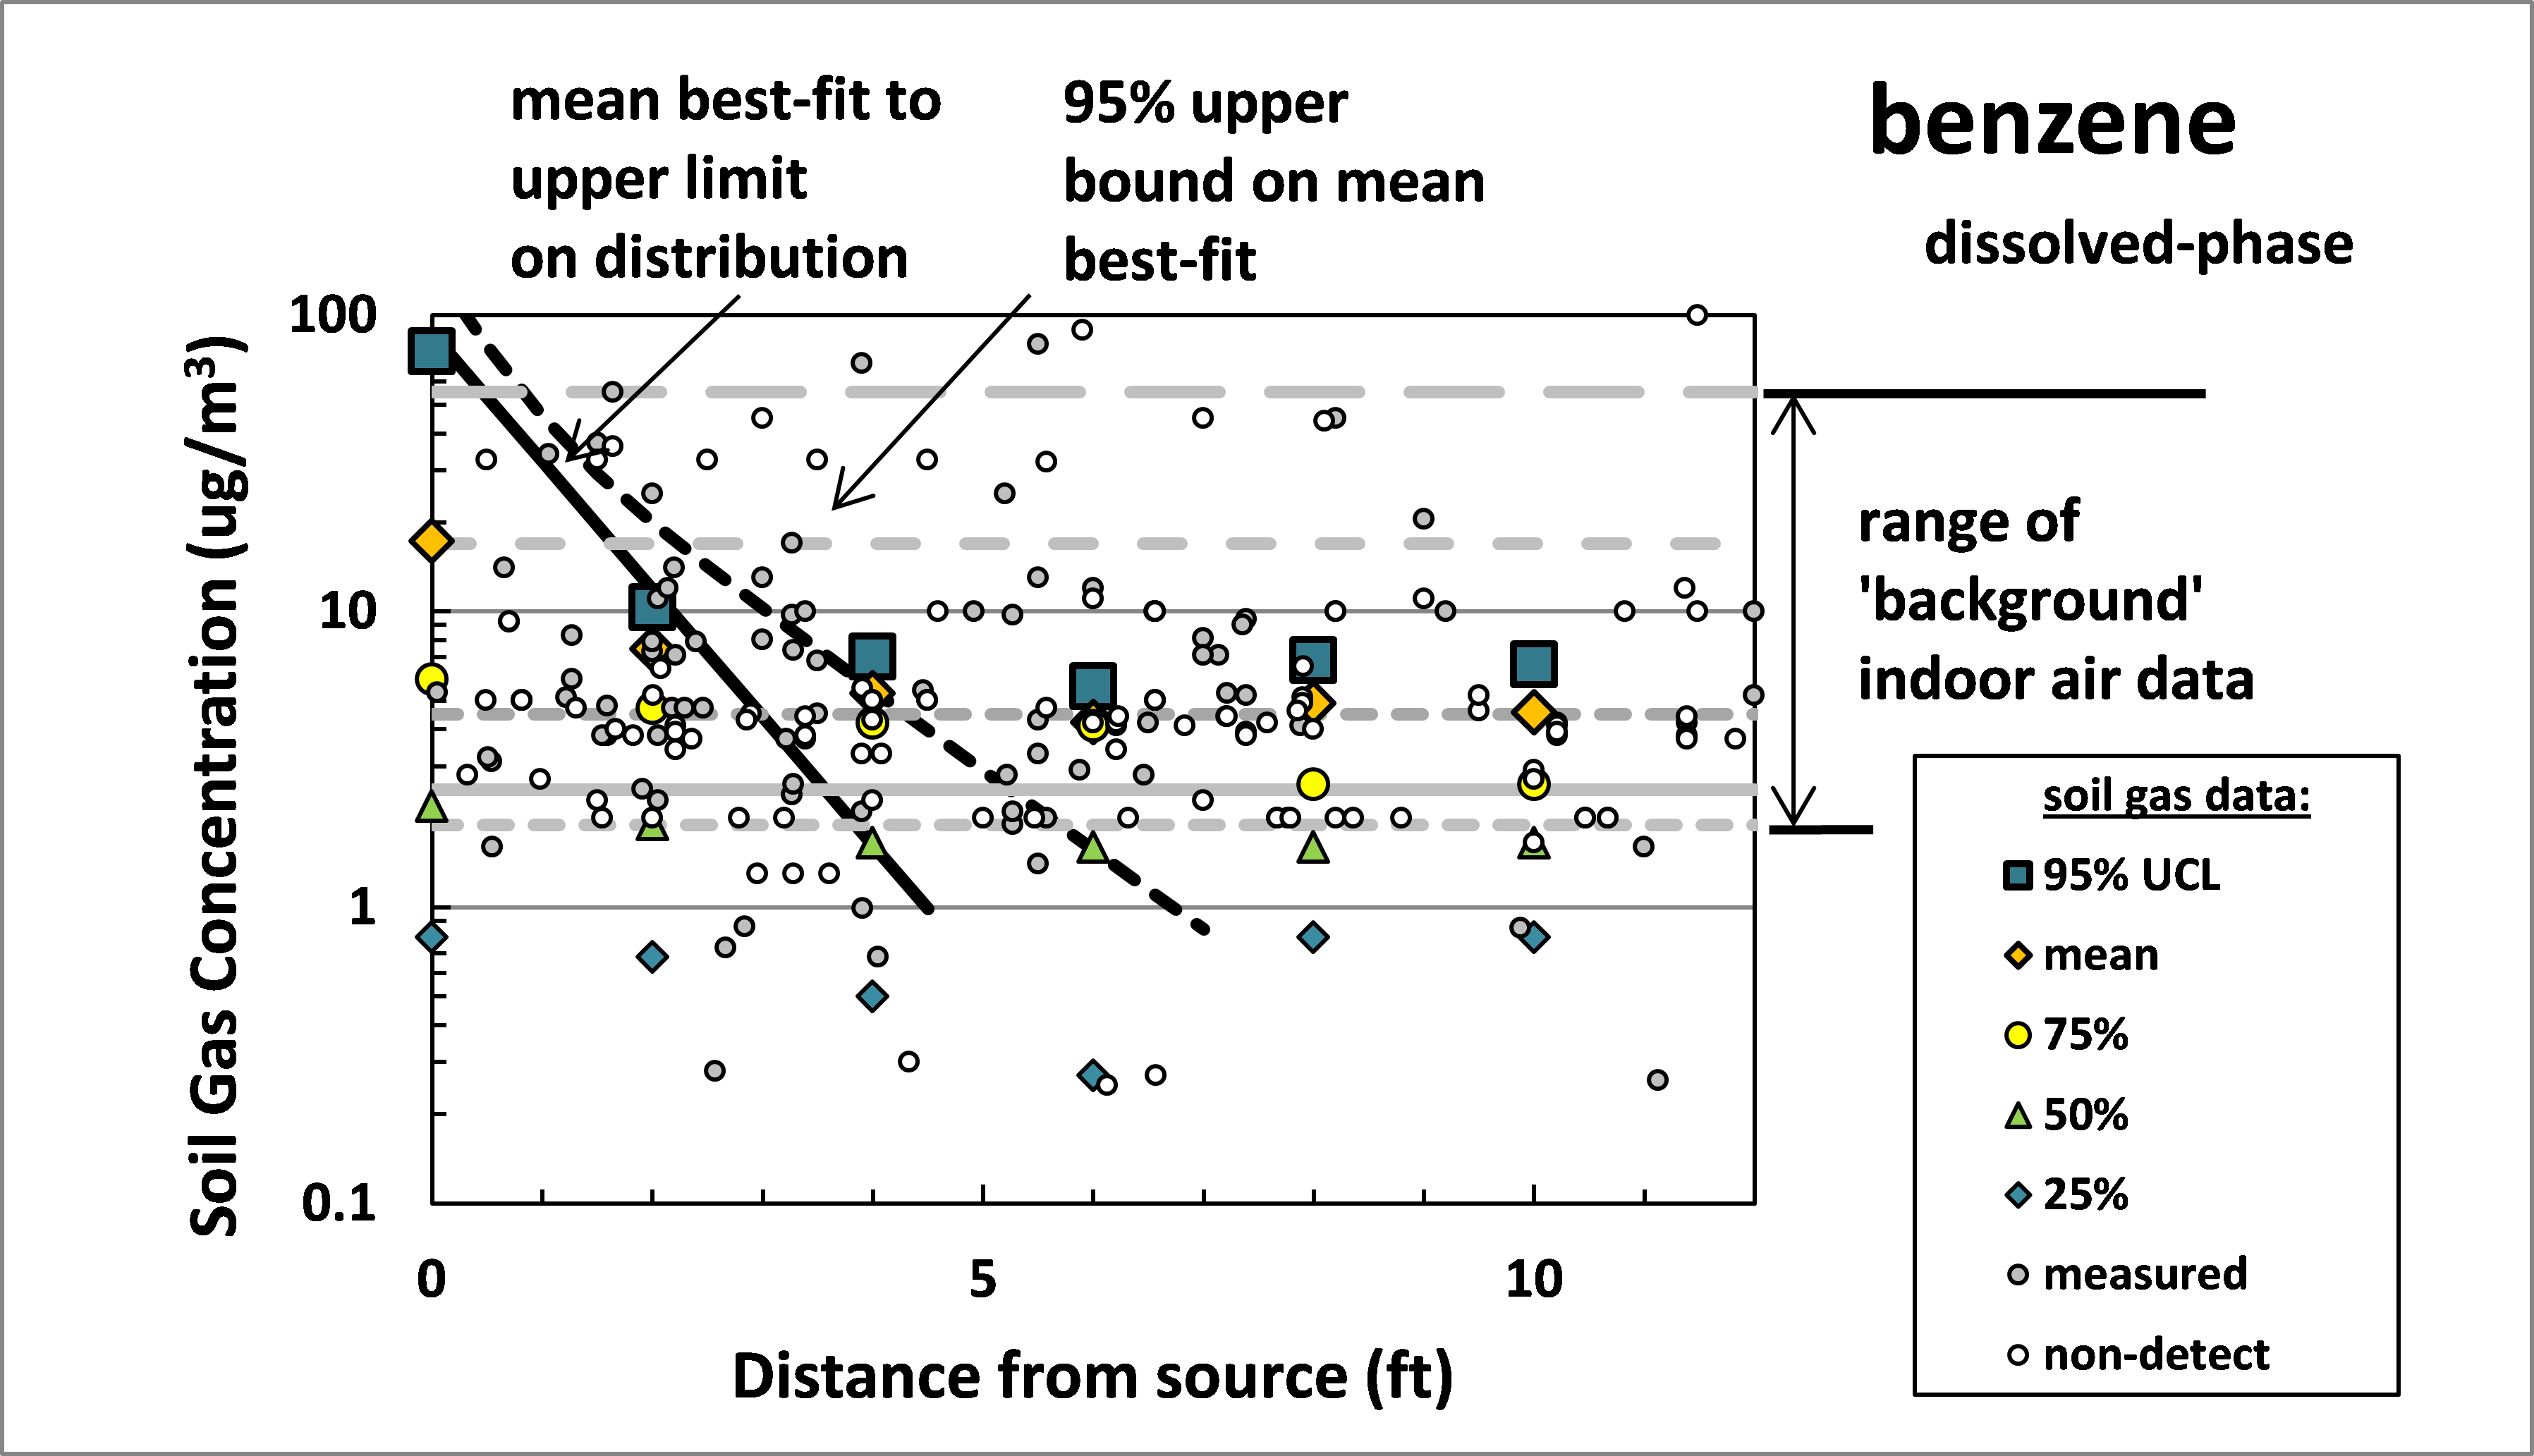
Figure F-2. Vertical screening distance values for a dissolved phase groundwater vapor source based on soil gas data analysis from Lahvis et al. (2013a). A mean best-fit to the distribution and an upper bound on the mean best-fit are shown. The overlap of lower-level soil gas data with background concentrations (Dawson and McAlary, 2009) is also shown.
|
Parameter |
LNAPL |
Dissolved phase |
|---|---|---|
|
Single-sided confidence interval (a) |
0.05 |
0.05 |
|
Student t statistic (tN-2,a) |
2.45 |
2.45 |
|
Mean slope m = (- 1 / LR) (1/feet) |
-1.91 |
-1.00 |
|
Intercept ln [ c0 ] ln(μg/m3) |
28.5 |
4.47 |
|
Standard error in m |
0.265 |
0.248 |
|
Coefficient of determination, r2 |
0.928 |
0.941 |
|
Standard error for the estimate of ln[c] sy|x |
1.06 |
0.351 |
|
(Minimum) number of data pairs, N |
6 |
6 |
|
Average distance |
12 |
1 |
|
Sample variance in distance sx (feet2) |
3.2 |
1 |
Characterization of the PHC vapor source (determining whether it is present as dissolved-phase or LNAPL) is a critical piece of information needed to apply the screening-distance method. The identification of source type can be difficult, however, especially if LNAPL is not readily apparent in a nearby groundwater monitoring well (see Chapter 2). For this reason, soil sampling and field screening of soil cores using a photoionization detector (PID) or flame ionization detector are recommended during the initial stages of a site investigation. The soil sampling and field screening should focus in the immediate proximity of the known or expected PHC release (near UST systems or an AST), along perching or low-permeability soil layers, or just above the water table as a result of water-table induced smearing. Soil samples alone may not be sufficient as a standalone criterion for LNAPL identification, however (see Table 3-1). In general, LNAPL sources located above the water table will tend to biodegrade fairly rapidly provided the PHC release has been stopped.
High-organic rich soils, such as peat, are prone to oxidation via natural respiration which can compete with PHC for available O2. For this reason, organic-rich soils are included as a precluding factor for site screening if located between the PHC vapor source and building foundation.
Although O2 soil gas concentrations over 2 to 4% vol/vol can be used to document aerobic biodegradation conditions in the vadose zone, these and other soil gas data are not necessary for the application of the PVI screening distance method provided any primary and secondary LNAPL sources in the vadose zone have been properly identified (see Table 3-1 and Section 3.1.3). O2 soil gas concentration measurements were not directly used in the derivation of vertical screening distances.
The use of screening distances in regulatory site screening is not new. USEPA, for example, proposed a screening distance of 100 feet (applied both laterally and vertically) for all COCs, including hydrocarbon and chlorinated compounds (USEPA 2002b). The screening distance was based on professional judgment given that vapor intrusion had not been documented at any residences located more than 100 feet laterally from the interpolated edge of a chlorinated hydrocarbon plume. A 100-foot screening distance was subsequently adopted by many states for use at PVI sites.
More recently, some states have recommended shorter screening distances for PHC (Connecticut DEP 2003; Pennsylvania DEP 2004; New Hampshire DES 2006; Wisconsin DNR 2010); California State Water Resources Control Board 2012); Indiana DEM 2012; Michigan DEQ 2012; New Jersey DEP 2013a) and other organizations (Atlantic PIRI 2006; ASTM 2010b). These distances range from 5 feet (NJ DEP 2013a; California State Water Resources Control Board, 2012) to 30 feet for dissolved-phase sources and from 30 to 100 feet for LNAPL sources. In the New Jersey guidance and California policy, the shorter screening distances can only be applied if O2 concentrations in soil gas exceed 2% vol/vol (for New Jersey) to and 5% vol/vol (for California). Note that the referenced regulatory guidance and policy documents referenced here were published developed prior to the empirical studies.
Hydrocarbon soil and groundwater concentration measurements are critical to identifying LNAPL sources in soil or groundwater (see Table 3-1), and as such are important site data to support PVI screening. Such measurements, however, are not good predictors of hydrocarbon concentrations in soil gas (vapor that could potentially migrate to indoor air). In particular, Golder Associates (2008), Lahvis et al. (2013a), and USEPA (2013a) have shown:
Soil concentration data were also not used significantly in the derivation of screening distances. Soil concentration data were used by USEPA (2013a) to identify residual-phase LNAPL sources in < 2% (21 of 1332) cases and were not used by Lahvis et al. (2013a).
Based on reviews of the PVI database, maximum vertical screening distances derived for other individual, indicator compounds (and discussed in Chapter 3) are also considered to be adequate for noncompound-specific TPH fractions such as C5–C8 aliphatics, C9–C12 aliphatics, C9–C18 aromatics (Hers and Truesdale 2012; USEPA 2013a). TPH concentrations in soil and groundwater may, however, be useful in helping identify LNAPL sources or determining the type of LNAPL present (see Chapter 3, Table 3-1).
A number of states, including Hawaii, incorporate a risk-based evaluation of TPH, either by policy or guidance, into their approach for assessing PVI. This approach often requires the collective assessment of nonspecific, TPH-related compounds in targeted carbon ranges (such as C5–8 and C9–C12 aliphatics) in addition to individually targeted compounds. Local regulatory agencies can provide specific requirements related to PVI that apply to sites in their jurisdiction.
For dissolved-phase sources, the vertical separation distance is determined from the base of the current or future anticipated building foundation to the shallowest water-table elevation. Although the shallowest water-table elevation cannot be known with exact certainty, some ambiguity is accounted for (including the capillary zone) in the recommended 5 feet vertical screening distance for dissolved-phase PHC sources. The empirical studies by Lahvis et al. (2013a) and USEPA (2013a) showed that benzene concentrations in soil gas were more than 30–50 mg/m3 in approximately 95% of cases even directly above ( within 1 to 2 feet) the water table (dissolved-phase sources posed little risk for PVI unless in contact with a building foundation). These findings were based on the vertical-distance method.
For LNAPL sources, the vertical separation distance is determined from the base of the current or future anticipated building foundation to the top (or shallowest elevation) of the residual-phase source (or LNAPL smear zone). The depth to the LNAPL source should be determined during borehole development (i.e., monitoring well installation) using soil sampling and field screening (see Table 3-1). The maximum estimated or anticipated water-table elevation can be used as a rough indicator of the top of an LNAPL source at sites where soil and field screening data are not readily available. In addition, the vertical screening distances recommended for LNAPL sources should account for some uncertainty in the depth to the LNAPL source given that this information was not reported in the soil gas databases evaluated by Lahvis et al. (2013a) and USEPA (2013a).
Methane can be generated through anaerobic biodegradation of PHCs in soil and groundwater and occurs mainly at non-UST (industrial) sites with large gasoline and diesel LNAPL sources (USEPA 2013a). Methane generation has also been shown to be significant for gasoline releases containing more than 10% vol/vol ethanol (Ma et al. 2012), although currently there are no empirical data from hydrocarbon sites to document this. Methane is a concern for PVI because it can create potential explosive (safety and acute risk) conditions in confined space conditions (see Chapter 2). Methane can also increase the potential for PVI by enhancing bulk gas flow (advection) of PHCs and reducing oxygen availability for aerobic PHC biodegradation between the petroleum source and building foundation (see Chapter 2). No published cases, however, have been identified in which methane has generated a PVI issue at a UST site (USEPA, 2013a).
The empirical soil-gas database study conducted by the USEPA (2013a) found methane elevated above the lower explosive limit (> 5% vol/vol) in soil gas at 5 of 27 sites with LNAPL sources, three of which were retail (UST), and two nonretail (refinery). Methane soil-gas concentrations were less than 1% at the remaining 22 sites. Methane concentrations in soil gas were generally below 5% within approximately 10 feet of the PHC source. This distance is less than the vertical screening distance of 15 feet recommended for LNAPL sources. Methane was also not shown to enhance the potential for benzene migration to indoor air. Lastly, methane concentrations in soil gas greater than 1% vol/vol were only observed at sites with LNAPL sources (USEPA 2013a) and thus could serve as a potential LNAPL indicator.